| Table of Contents |
|---|
Pre-Requisite
Install Graphviz
Mac:
| Code Block |
|---|
brew install graphviz |
Linux:
| Code Block |
|---|
sudo apt install graphviz |
Windows:
See https://graphviz.org/download/
Install Benchstat
| Code Block |
|---|
cd ~
go install golang.org/x/perf/cmd/benchstat@latest |
Benchmarks
We can add in a benchmark test which will allow us to profile a section of code.
Creating Profiles from Benchmark Test
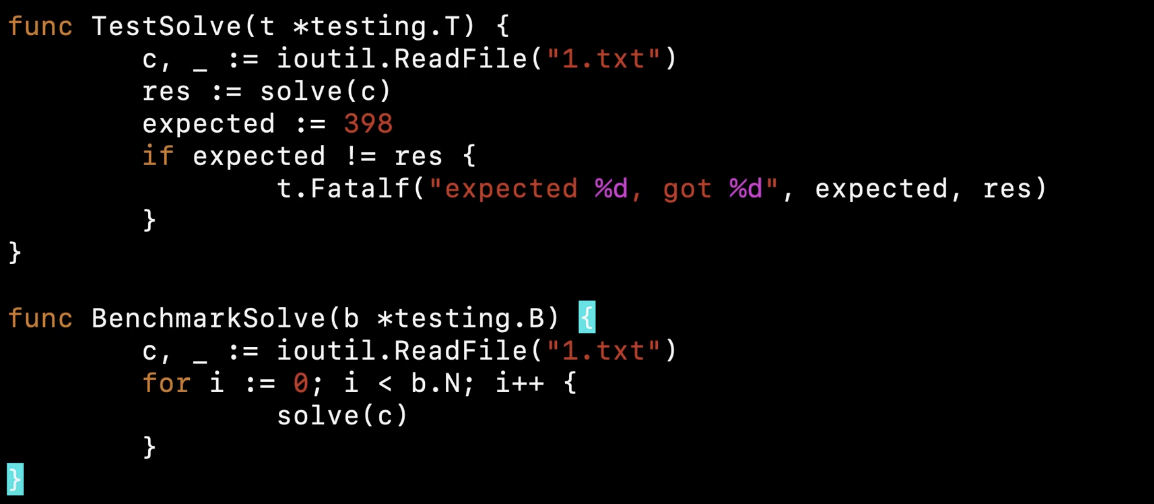
Adding a Benchmark
Profiling your Benchmark

| Code Block |
|---|
go test -bench=. -run=x -benchmem -memprofile mem.prof -cpuprofile cpu.prof -benchtime=10s > 0.bench |
After running the benchmark we can use the outputted profiles with pprof.
Adding Profiling to your Application
Add the following code:
| Code Block |
|---|
import (
	echopprof "github.com/hiko1129/echo-pprof"
	"github.com/labstack/echo/v4"
)

func Start(){

	e := echo.New()
	echopprof.Wrap(e)
	e.Start(":8080")
}
|
Pull Metric from Endpoint
| Code Block |
|---|
curl -sK -v http://localhost:8888/debug/pprof/heap > heap.out |
Open heap.out in pprof
| Code Block |
|---|
go tool pprof heap.out |
Profiling with Pprof
CPU Profiling
| Code Block |
|---|
$ go tool pprof cpu.prof
Type: cpu
Time: Jul 15, 2022 at 1:25pm (EDT)
Duration: 7.34s, Total samples = 7.45s (101.51%)
Entering interactive mode (type "help" for commands, "o" for options)
(pprof)
|
top 20
| Code Block |
|---|
(pprof) top 20
Showing nodes accounting for 7.18s, 96.38% of 7.45s total
Dropped 81 nodes (cum <= 0.04s)
Showing top 20 nodes out of 134
      flat  flat%   sum%        cum   cum%
     1.56s 20.94% 20.94%      1.56s 20.94%  runtime.kevent
     1.45s 19.46% 40.40%      1.45s 19.46%  runtime.madvise
     0.79s 10.60% 51.01%      1.18s 15.84%  encoding/json.checkValid
     0.68s  9.13% 60.13%      0.68s  9.13%  encoding/json.unquoteBytes
     0.48s  6.44% 66.58%      0.48s  6.44%  encoding/json.(*decodeState).rescanLiteral
     0.37s  4.97% 71.54%      0.37s  4.97%  encoding/json.stateInString
     0.37s  4.97% 76.51%      0.37s  4.97%  runtime.pthread_cond_signal
     0.31s  4.16% 80.67%      0.31s  4.16%  runtime.pthread_kill
     0.26s  3.49% 84.16%      0.27s  3.62%  encoding/json.(*encodeState).string
     0.21s  2.82% 86.98%      0.21s  2.82%  syscall.syscall
     0.20s  2.68% 89.66%      0.20s  2.68%  runtime.usleep
     0.19s  2.55% 92.21%      0.19s  2.55%  runtime.pthread_cond_wait
     0.13s  1.74% 93.96%      0.13s  1.74%  unicode/utf8.RuneCountInString
     0.04s  0.54% 94.50%      0.04s  0.54%  runtime.memmove
     0.04s  0.54% 95.03%      0.10s  1.34%  runtime.scanobject
     0.03s   0.4% 95.44%      0.07s  0.94%  kafka-azure-sink/src/internal/gateways/kafka/consumer.randomString
     0.03s   0.4% 95.84%      0.04s  0.54%  runtime.findObject
     0.02s  0.27% 96.11%      0.44s  5.91%  runtime.gcDrain
     0.01s  0.13% 96.24%      1.18s 15.84%  encoding/json.(*decodeState).objectInterface
     0.01s  0.13% 96.38%      0.13s  1.74%  runtime.gopreempt_m
(pprof)
|
Using List to output annotated source
| Code Block |
|---|
(pprof) list encoding/json.checkValid
Total: 12.96s
ROUTINE ======================== encoding/json.checkValid in /usr/local/go/src/encoding/json/scanner.go
     690ms      1.17s (flat, cum)  9.03% of Total
         .          .     27:
         .          .     28:// checkValid verifies that data is valid JSON-encoded data.
         .          .     29:// scan is passed in for use by checkValid to avoid an allocation.
         .          .     30:func checkValid(data []byte, scan *scanner) error {
         .          .     31:	scan.reset()
     130ms      140ms     32:	for _, c := range data {
     120ms      120ms     33:		scan.bytes++
     440ms      910ms     34:		if scan.step(scan, c) == scanError {
         .          .     35:			return scan.err
         .          .     36:		}
         .          .     37:	}
         .          .     38:	if scan.eof() == scanError {
. . 39: return scan.err |
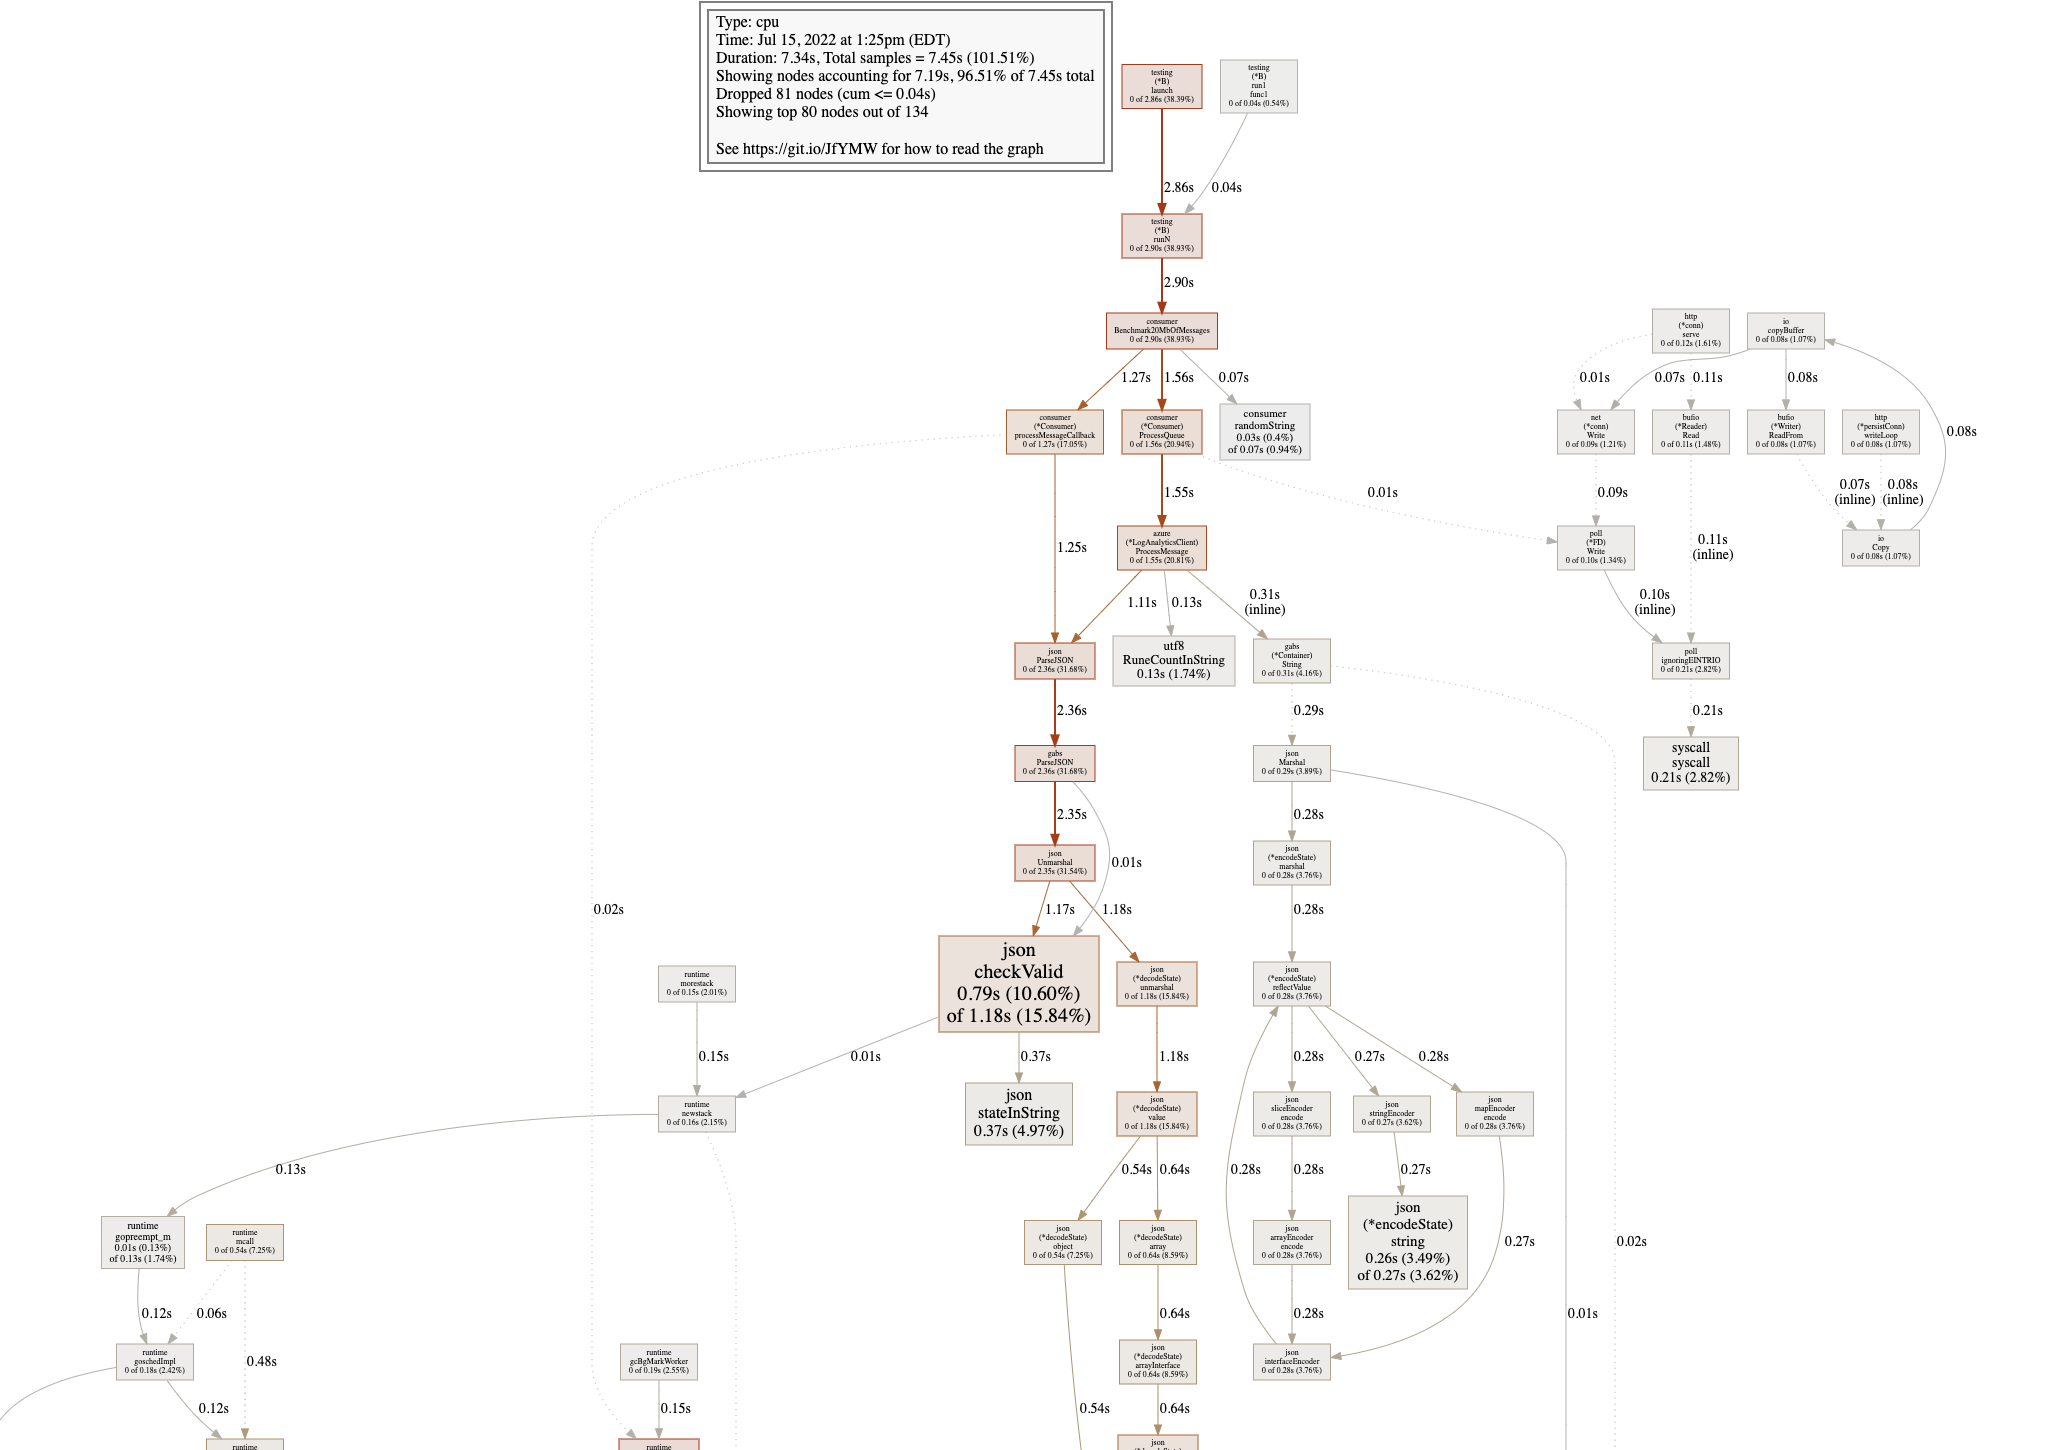
Visualize It
| Code Block |
|---|
(pprof) web |
Memory Profiling
| Code Block |
|---|
$ go tool pprof mem.prof
Type: alloc_space
Time: Jul 19, 2022 at 11:17am (EDT)
Entering interactive mode (type "help" for commands, "o" for options)
(pprof)
|
top 10
| Code Block |
|---|
(pprof) top
Showing nodes accounting for 19.94GB, 99.26% of 20.09GB total
Dropped 168 nodes (cum <= 0.10GB)
Showing top 10 nodes out of 45
      flat  flat%   sum%        cum   cum%
    5.25GB 26.14% 26.14%     5.25GB 26.14%  io.ReadAll
    2.11GB 10.52% 36.66%     4.20GB 20.89%  kafka-azure-sink/src/internal/util/json.ParseJSON
    2.10GB 10.44% 47.11%     2.10GB 10.44%  fmt.(*buffer).writeString (inline)
    2.10GB 10.43% 57.54%     4.20GB 20.90%  fmt.Sprintf
    2.09GB 10.42% 67.95%    10.53GB 52.42%  kafka-azure-sink/src/internal/gateways/kafka/consumer.(*Consumer).ProcessQueue
    2.08GB 10.35% 78.31%     2.08GB 10.35%  encoding/json.unquote (inline)
    1.07GB  5.32% 83.63%     3.15GB 15.67%  github.com/Jeffail/gabs/v2.(*Container).String (inline)
    1.06GB  5.29% 88.92%     6.35GB 31.63%  kafka-azure-sink/src/internal/gateways/azure.(*LogAnalyticsClient).ProcessMessage
    1.04GB  5.19% 94.12%     2.08GB 10.34%  encoding/json.Marshal
    1.03GB  5.15% 99.26%     1.03GB  5.15%  bytes.makeSlice
|
Using List to output annotated source
| Code Block |
|---|
(pprof) list json.ParseJSON
Total: 20.09GB
ROUTINE ======================== kafka-azure-sink/src/internal/util/json.ParseJSON in /Users/john/projects/netguard_cyberdome/services/kafka-azure-sink/src/internal/util/json/json_util.go
    2.11GB     4.20GB (flat, cum) 20.89% of Total
         .          .      8:)
         .          .      9:
         .          .     10:func ParseJSON(message string) (*gabs.Container, error) {
         .          .     11:
         .          .     12:	//parse message as JSON
    2.11GB     4.20GB     13:	json, err := gabs.ParseJSON([]byte(message))
         .          .     14:	if err != nil {
         .          .     15:		logrus.Errorf("Failed to parse json message: %s", message)
         .          .     16:		return nil, err
         .          .     17:	}
. . 18: return json, nil |
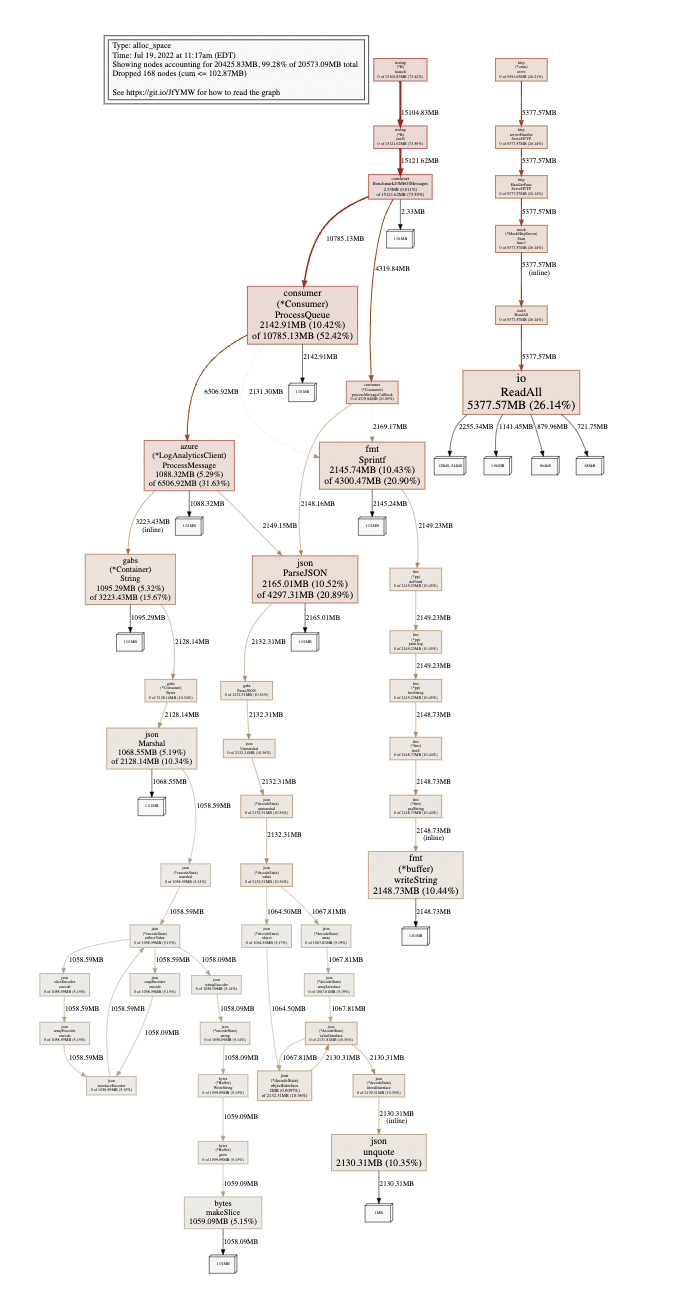
Visualize It
| Code Block |
|---|
(pprof) web |
References
| Reference | URL |
|---|---|
| Go (Golang) Profiling Tutorial | https://www.youtube.com/watch?v=HEwSkhr_8_M |
| How I investigated memory leaks in Go using pprof on a large codebase | https://www.freecodecamp.org/news/how-i-investigated-memory-leaks-in-go-using-pprof-on-a-large-codebase-4bec4325e192/ |