...
See https://graphviz.org/download/
Install Benchstat
| Code Block |
|---|
cd ~
go install golang.org/x/perf/cmd/benchstat@latest |
Benchmarks
We can add in a benchmark test which will allow us to profile a section of code.
...
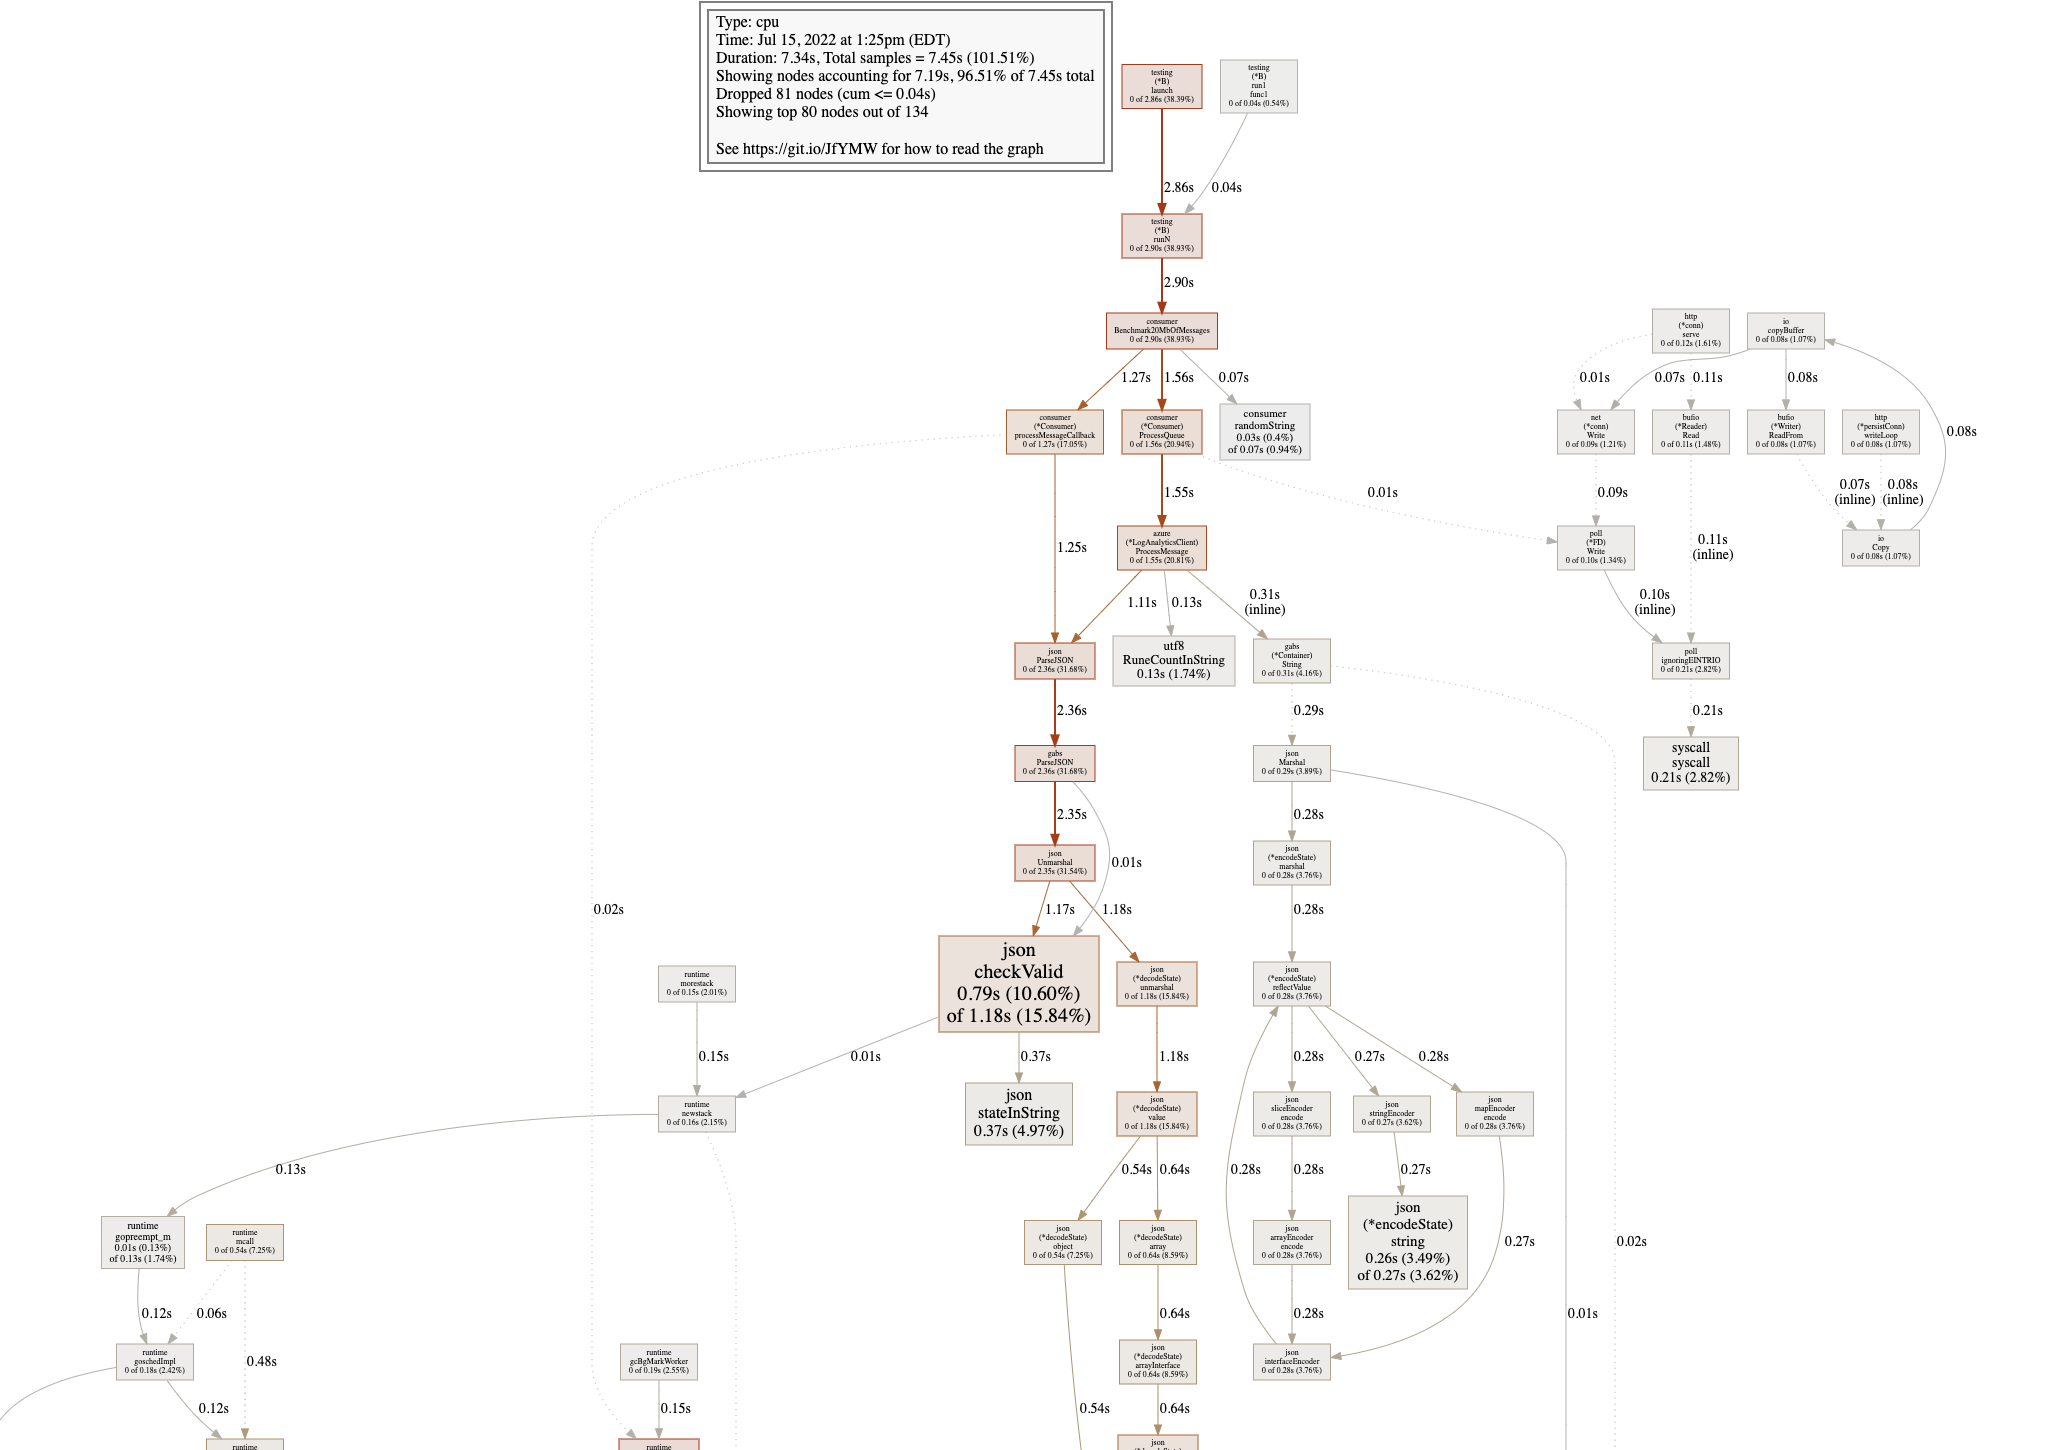
Visualize It
| Code Block |
|---|
(pprof) web |
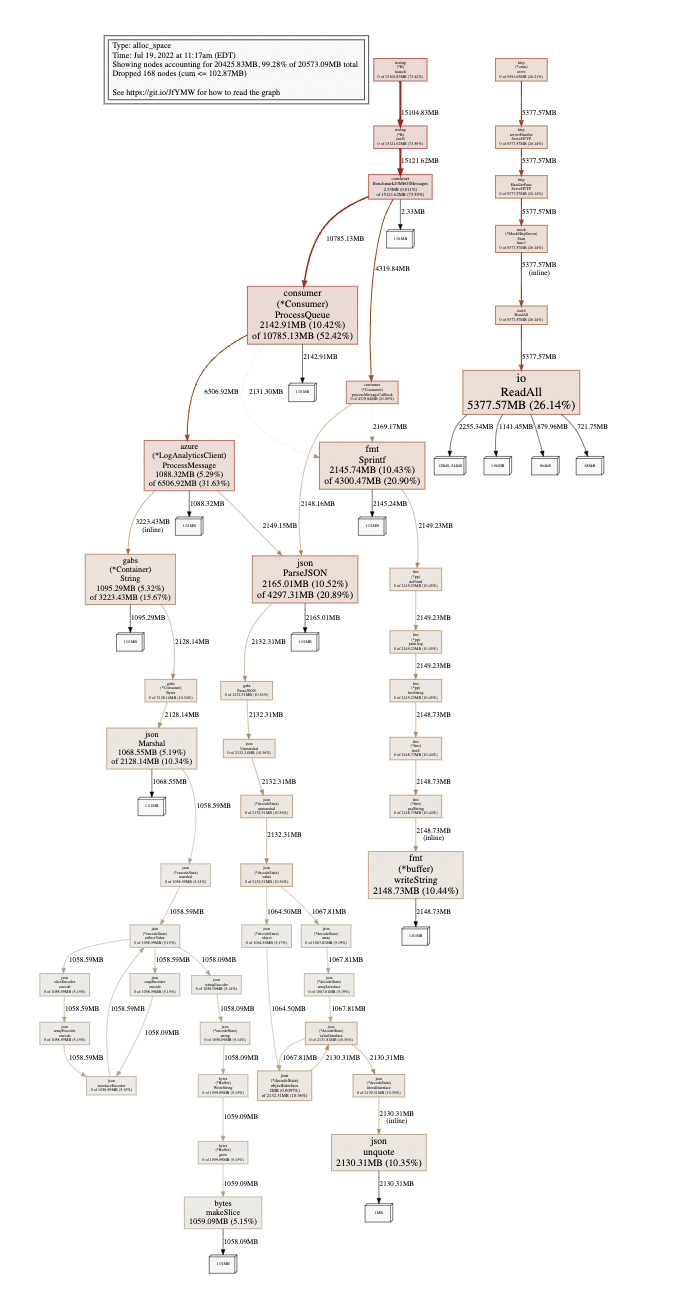
Memory Profiling
| Code Block |
|---|
$ go tool pprof mem.prof Type: alloc_space Time: Jul 19, 2022 at 11:17am (EDT) Entering interactive mode (type "help" for commands, "o" for options) (pprof) |
...
Visualize It
| Code Block |
|---|
(pprof) web |
References
| Reference | URL |
|---|---|
| Go (Golang) Profiling Tutorial | https://www.youtube.com/watch?v=HEwSkhr_8_M |
| How I investigated memory leaks in Go using pprof on a large codebase | https://www.freecodecamp.org/news/how-i-investigated-memory-leaks-in-go-using-pprof-on-a-large-codebase-4bec4325e192/ |
...