...
| Code Block |
|---|
brew install graphviz |
Adding Profiling to your Application
Add the following code:
| Code Block |
|---|
import (
	"github.com/labstack/echo/v4"
	"net/http"
	_ "net/http/pprof"
)

	e := echo.New()

	//profiler
	e.GET("/debug/pprof/*", echo.WrapHandler(http.DefaultServeMux))
|
Pull Metric from Endpoint
| Code Block |
|---|
curl -sK -v http://localhost:8080/debug/pprof/heap > heap.out |
Open heap.out in pprof
| Code Block |
|---|
go tool pprof heap.out |
Adding a Benchmark
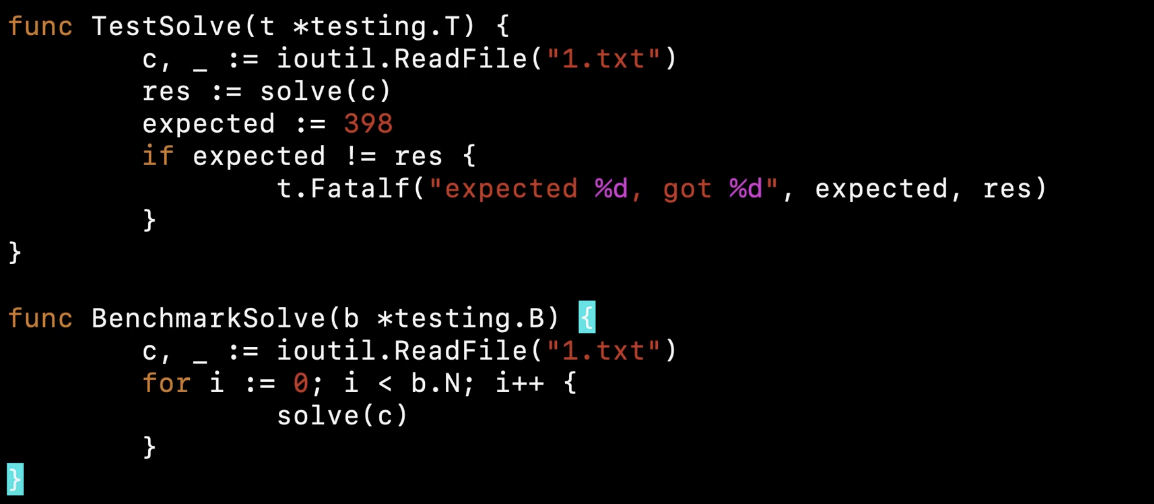
Profiling your Benchmark
...
| Reference | URL |
|---|---|
| Go (Golang) Profiling Tutorial | https://www.youtube.com/watch?v=HEwSkhr_8_M |
| How I investigated memory leaks in Go using pprof on a large codebase | https://www.freecodecamp.org/news/how-i-investigated-memory-leaks-in-go-using-pprof-on-a-large-codebase-4bec4325e192/ |