...
Add the following code:
| Code Block |
|---|
import ( echopprof "github.com/labstackhiko1129/echo/v4-pprof" "net/http" _ "net/http/pprofgithub.com/labstack/echo/v4" ) func Start(){ e := echo.New() //profilerechopprof.Wrap(e) e.GETStart("/debug/pprof/*", echo.WrapHandler(http.DefaultServeMux)) :8080") } |
Pull Metric from Endpoint
...
| Code Block |
|---|
go tool pprof heap.out |
| Code Block |
|---|
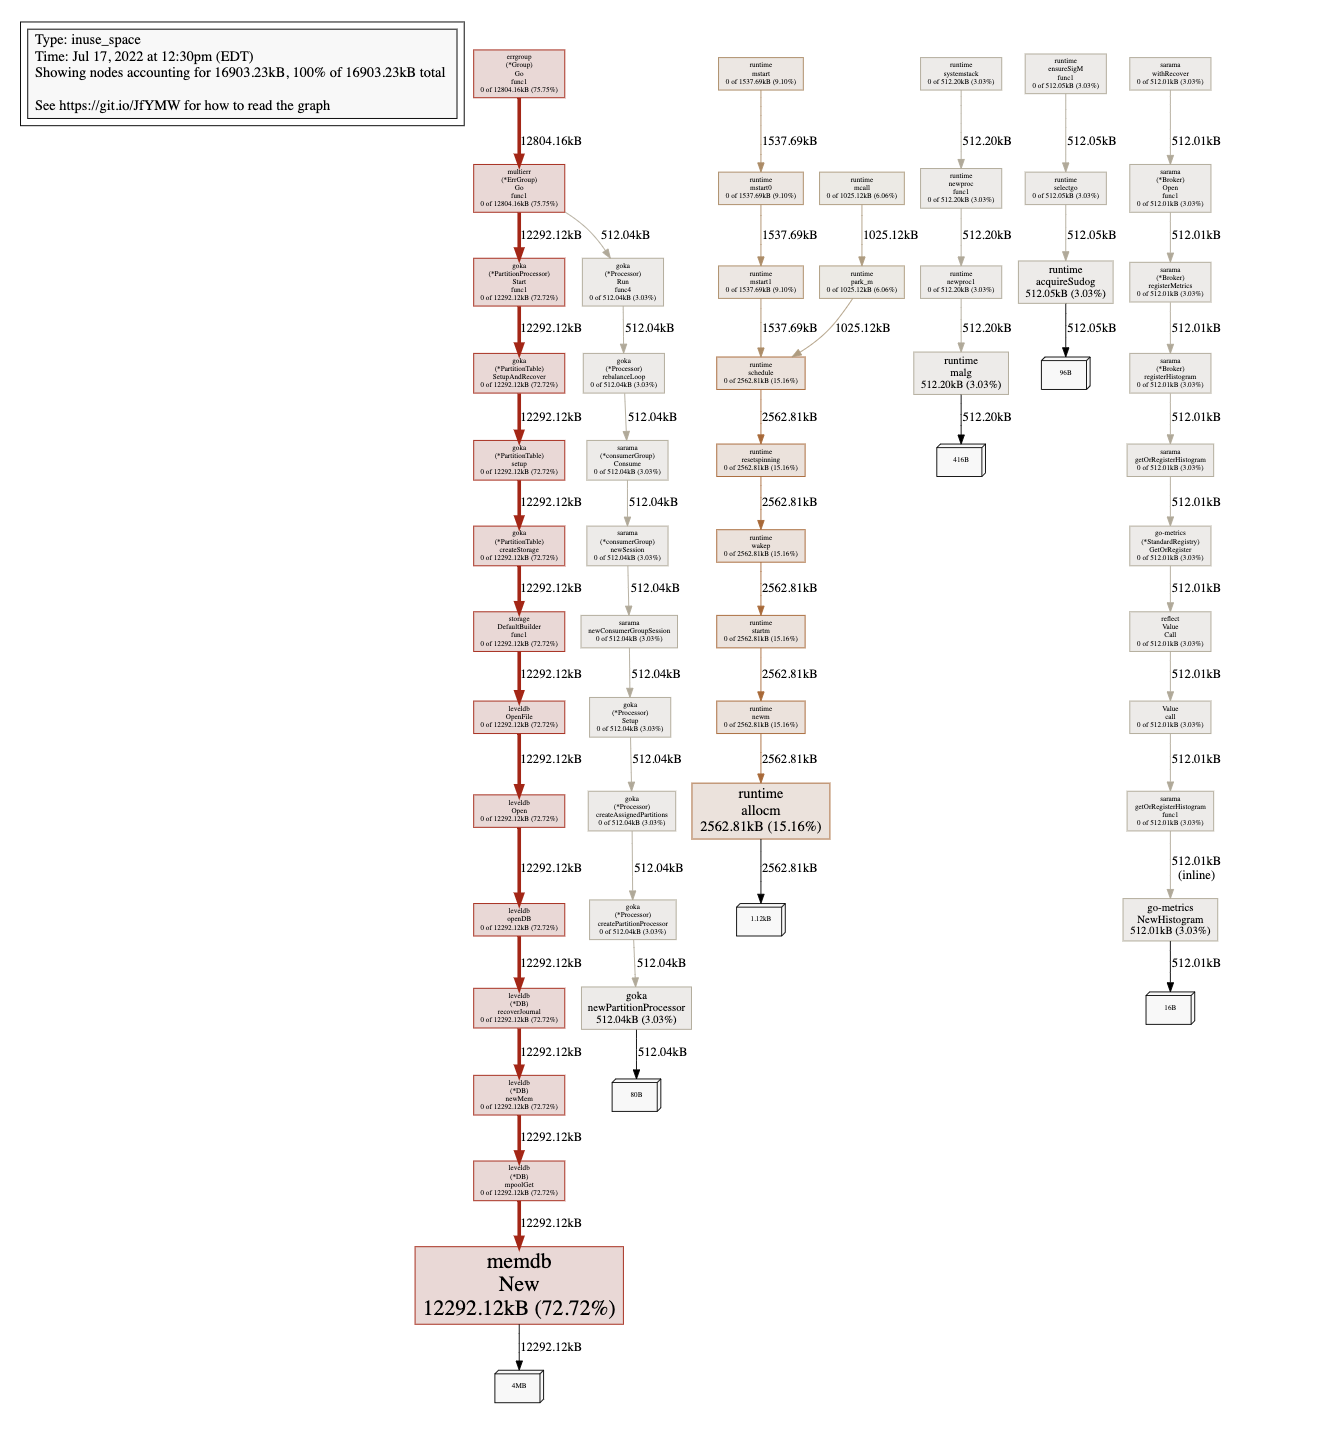
(pprof) top

Showing nodes accounting for 16903.23kB, 100% of 16903.23kB total
Showing top 10 nodes out of 51
      flat  flat%   sum%        cum   cum%
12292.12kB 72.72% 72.72% 12292.12kB 72.72%  github.com/syndtr/goleveldb/leveldb/memdb.New
 2562.81kB 15.16% 87.88%  2562.81kB 15.16%  runtime.allocm
  512.20kB  3.03% 90.91%   512.20kB  3.03%  runtime.malg
  512.05kB  3.03% 93.94%   512.05kB  3.03%  runtime.acquireSudog
  512.04kB  3.03% 96.97%   512.04kB  3.03%  github.com/lovoo/goka.newPartitionProcessor
  512.01kB  3.03%   100%   512.01kB  3.03%  github.com/rcrowley/go-metrics.NewHistogram (inline)
         0     0%   100%   512.01kB  3.03%  github.com/Shopify/sarama.(*Broker).Open.func1
         0     0%   100%   512.01kB  3.03%  github.com/Shopify/sarama.(*Broker).registerHistogram
         0     0%   100%   512.01kB  3.03%  github.com/Shopify/sarama.(*Broker).registerMetrics
0 0% 100% 512.04kB 3.03% github.com/Shopify/sarama.(*consumerGroup).Consume |
| Code Block |
|---|
(pprof) web |
Adding a Benchmark
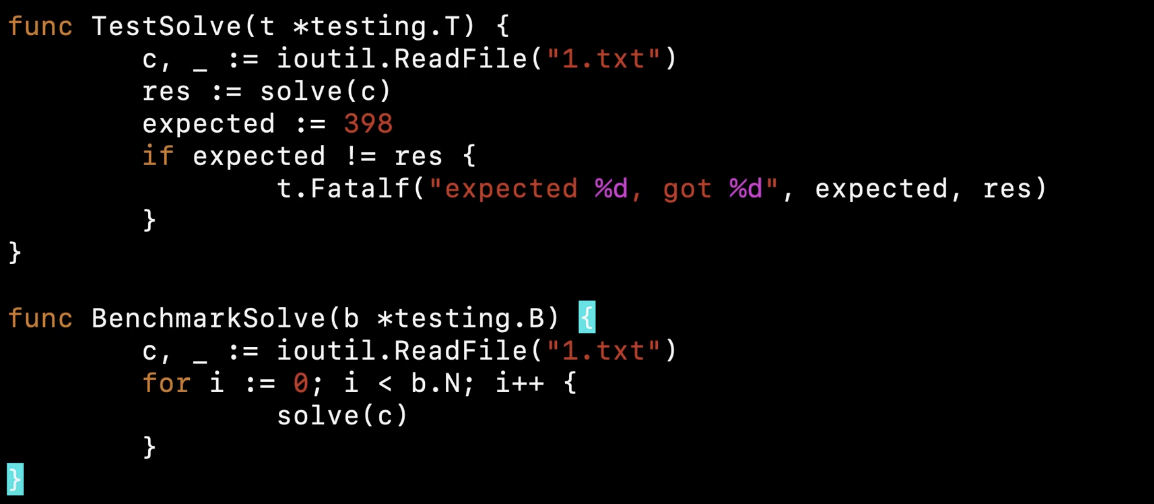
Profiling your Benchmark
...