| Table of Contents |
|---|
Pre-Requisite
Install Graphviz
...
See https://graphviz.org/download/
Benchmarks
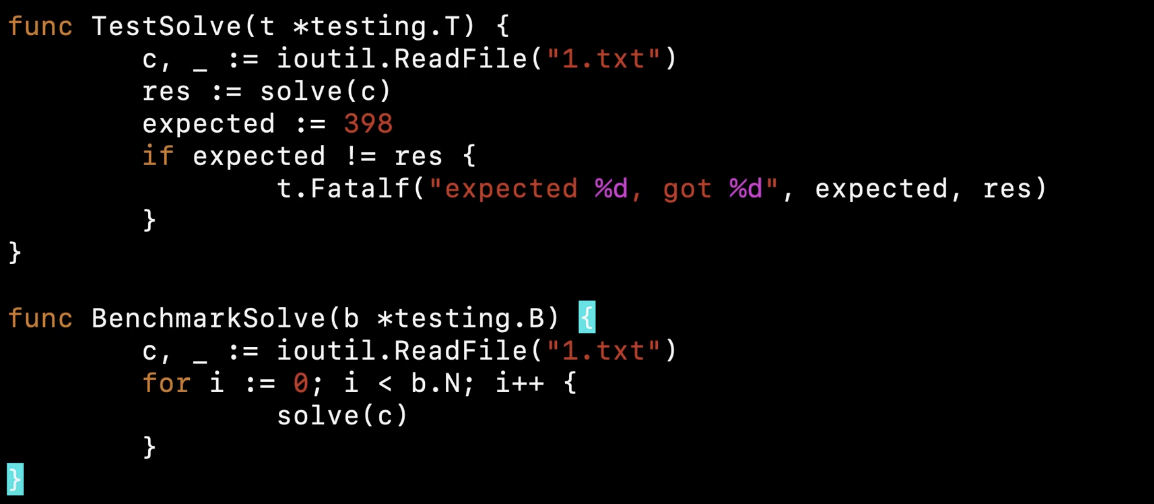
We can add in a benchmark test which will allow us to profile a section of code.
Creating Profiles from Benchmark Test
| Code Block |
|---|
go test -bench=. -run=x -benchmem -memprofile mem.prof -cpuprofile cpu.prof -benchtime=5s > 0.bench |
After running the benchmark we can use the outputted profiles with pprof.
Adding Profiling to your Application
...
| Code Block |
|---|
go tool pprof heap.out |
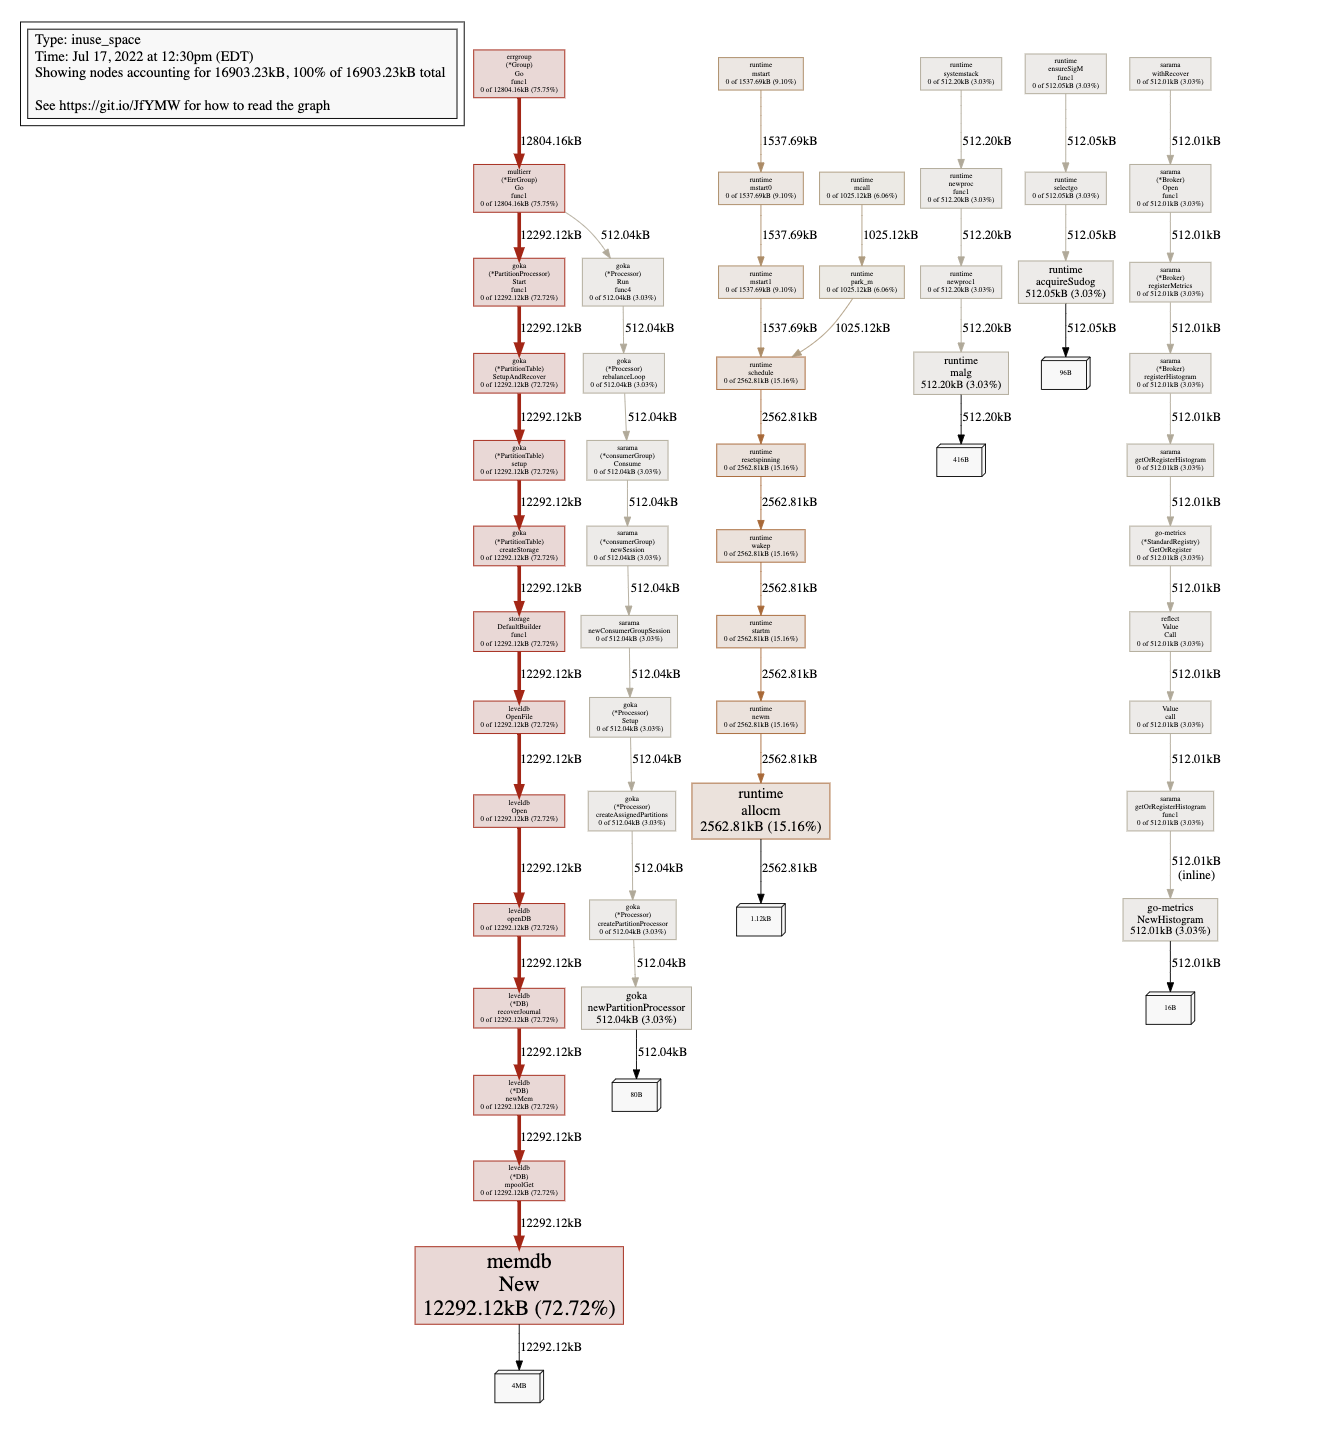
(pprof) top

Showing nodes accounting for 16903.23kB, 100% of 16903.23kB total
Showing top 10 nodes out of 51
      flat  flat%   sum%        cum   cum%
12292.12kB 72.72% 72.72% 12292.12kB 72.72%  github.com/syndtr/goleveldb/leveldb/memdb.New
 2562.81kB 15.16% 87.88%  2562.81kB 15.16%  runtime.allocm
  512.20kB  3.03% 90.91%   512.20kB  3.03%  runtime.malg
  512.05kB  3.03% 93.94%   512.05kB  3.03%  runtime.acquireSudog
  512.04kB  3.03% 96.97%   512.04kB  3.03%  github.com/lovoo/goka.newPartitionProcessor
  512.01kB  3.03%   100%   512.01kB  3.03%  github.com/rcrowley/go-metrics.NewHistogram (inline)
         0     0%   100%   512.01kB  3.03%  github.com/Shopify/sarama.(*Broker).Open.func1
         0     0%   100%   512.01kB  3.03%  github.com/Shopify/sarama.(*Broker).registerHistogram
         0     0%   100%   512.01kB  3.03%  github.com/Shopify/sarama.(*Broker).registerMetrics
0 0% 100% 512.04kB 3.03% github.com/Shopify/sarama.(*consumerGroup).Consume |
| Code Block |
|---|
(pprof) web |
Adding a Benchmark
Profiling your Benchmark
...
Profiling with Pprof
Profile CPU
| Code Block |
|---|
$ go tool pprof cpu.prof Type: cpu Time: Jul 15, 2022 at 1:25pm (EDT) Duration: 7.34s, Total samples = 7.45s (101.51%) Entering interactive mode (type "help" for commands, "o" for options) (pprof) |
...